October 2023 Cars Sales Analysis - SUV YoY, MoM Change, 6-Month Trend | V3Cars

In this October 2023 car sales analysis article, we’ll look at the YoY and MoM change in sales figures of all SUVs in India. We’ll also share our observations based on the sales data and possible reasons behind a massive increase or drop in sales, where applicable. Lastly, the table with monthly sales of all SUVs for the last 6 months will give you an idea about their 6-month sales trend.

SUV Sales

SUV Segment October 2023 Car Sales - YoY Change

  • Top Gainers:
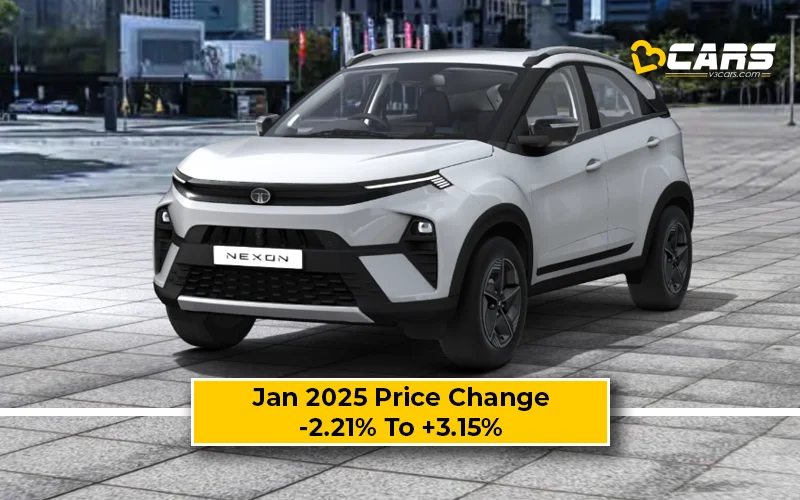
    • Maruti Suzuki Brezza (B2): Brezza takes the lead in YoY change with an impressive 61.45%, reflecting a substantial increase in demand. Maruti Suzuki's marketing strategies, model updates, or customer preferences might contribute to this surge.
    • Mahindra Scorpio N + Classic (D1): Scorpio N + Classic experiences a significant YoY increase of 82.55%, indicating strong market acceptance and demand for Mahindra's SUV offering.
    • Maruti Nexa Fronx (B2): Fronx enters the market with a strong start, recording 11,357 units in October 2023. The Nexa Fronx's unique features or marketing efforts could be driving its initial success.
  • Top Losers:
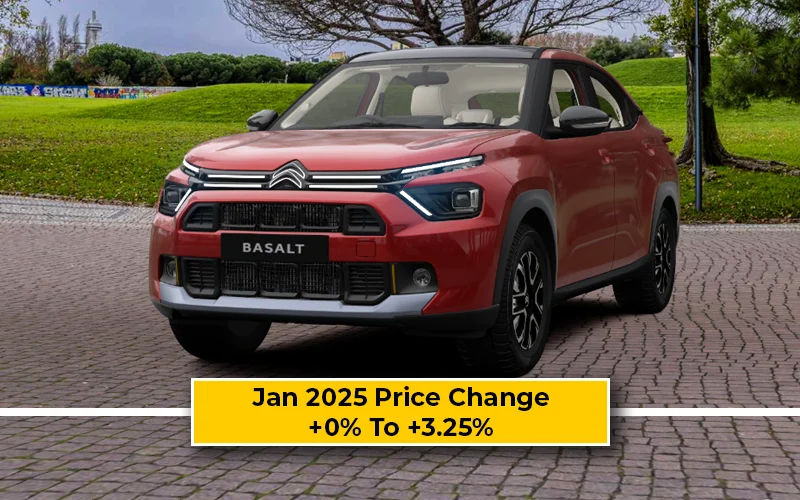
    • Citroen C3 (B2): C3 faces a substantial YoY decline of -81.19%, indicating challenges or changes in market dynamics for this Citroen model.
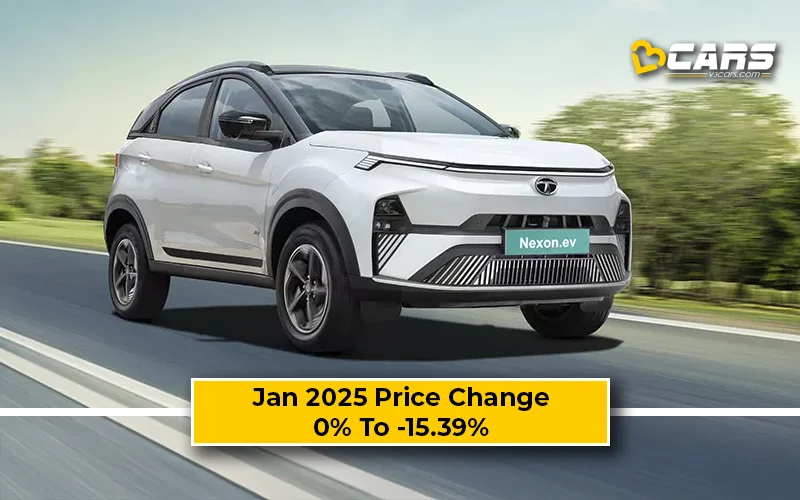
    • MG ZS EV (C1): ZS EV experiences a significant YoY decrease of -70.41%, possibly influenced by changes in electric vehicle market dynamics or competition.
    • Renault Kiger (B2): Kiger registers a notable YoY drop of -66.03%, suggesting a shift in market preferences or increased competition in the subcompact SUV segment.
  • Other Observations:
    • New Entrants: Fronx, Grand Vitara, Elevate, Jimny, EC3, and Meridian are either new models or introduced recently, contributing to the SUV segment's diversity.
    • Mixed Performance in Subcompact Segment: While Brezza and Nexon show positive YoY changes, Kiger faces a decline. This indicates varying success within the subcompact SUV category, potentially influenced by factors like design, features, or marketing.
    • Electric Vehicle Market Challenges: ZS EV and EV6 face YoY decreases, suggesting challenges in the electric vehicle market, including factors like charging infrastructure or pricing concerns.
    • Midsize SUV Dominance: Midsize SUVs like Scorpio, Creta, and Seltos continue to perform well, indicating sustained demand in this popular SUV segment.
    • Competitive Landscape: The SUV market remains highly competitive, with new entrants, model updates, and market dynamics contributing to the diverse performance observed across different models.
  • In summary, the SUV segment showcases a mix of strong performers and models facing challenges, reflecting the dynamic nature of the SUV market in October 2023. Factors such as innovation, market trends, and consumer preferences play pivotal roles in shaping the sales landscape

SUV OCTOBER 2023 CAR SALES

YOY CHANGE

S.No.

Brand

Model

Segment

Oct 2023

Oct 2022

Change

%Change

Trend

1

Tata

Nexon

B2

16,887

13,767

3,120

22.66%

2

Maruti Suzuki

Brezza

B2

16,050

9,941

6,109

61.45%

3

Tata

Punch

B1

15,317

10,982

4,335

39.47%

4

Mahindra

Scorpio N + Classic

D1

13,578

7,438

6,140

82.55%

5

Hyundai

Creta

C1

13,077

11,880

1,197

10.08%

6

Kia

Seltos

C1

12,362

9,777

2,585

26.44%

7

Hyundai

Venue

B2

11,581

9,585

1,996

20.82%

8

Maruti Nexa

Fronx

B2

11,357

-

11,357

-

-

9

Maruti Nexa

Grand Vitara

C1

10,834

8,052

2,782

34.55%

10

Mahindra

Bolero + Neo

B2

9,647

8,772

875

9.97%

11

Mahindra

XUV700

D1

9,297

5,815

3,482

59.88%

12

Hyundai

Exter

B2

8,097

-

8,097

-

-

13

Kia

Sonet

B2

6,493

7,614

-1,121

-14.72%

14

Mahindra

Thar

B2

5,593

3,666

1,927

52.56%

15

Honda

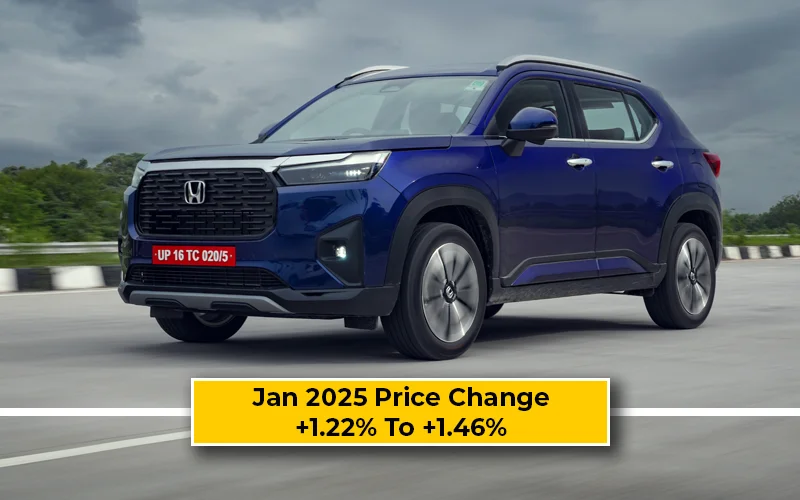
Elevate

C1

4,957

-

4,957

-

-

16

Mahindra

XUV300

B2

4,865

6,282

-1,417

-22.56%

17

Toyota

Hyryder

C1

3,987

3,384

603

17.82%

18

MG

Hector + Hector Plus

D1

2,703

1,630

1,073

65.83%

19

Nissan

Magnite

B2

2,573

2,819

-246

-8.73%

20

Toyota

Fortuner

D2

2,475

2,031

444

21.86%

21

Skoda

Kushaq

C1

2,447

1,691

756

44.71%

22

Volkswagen

Taigun

C1

2,219

2,355

-136

-5.77%

23

Tata

Harrier

C2

1,896

2,762

-866

-31.35%

24

Maruti Nexa

Jimny

B2

1,852

-

1,852

-

-

25

Hyundai

Alcazar

C2

1,837

2,847

-1,010

-35.48%

26

Tata

Safari

D1

1,340

1,751

-411

-23.47%

27

Renault

Kiger

B2

912

2,685

-1,773

-66.03%

28

MG

Astor

C1

890

1,774

-884

-49.83%

29

Mahindra

XUV400

B2

639

-

639

-

-

30

Jeep

Compass

C2

398

732

-334

-45.63%

31

MG

Gloster

D2

247

179

68

37.99%

32

MG

ZS EV

C1

232

784

-552

-70.41%

33

Citroen

C3

B2

222

1,180

-958

-81.19%

34

Hyundai

Tucson

D1

202

487

-285

-58.52%

35

Citroen

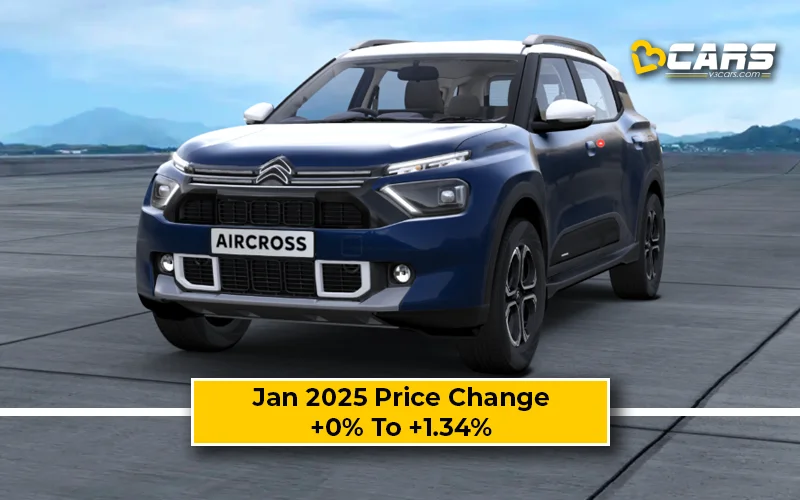
EC3

B2

179

-

179

-

-

36

Skoda

Kodiaq

D1

176

55

121

220.00%

37

Kia

EV6

D1

141

152

-11

-7.24%

38

Jeep

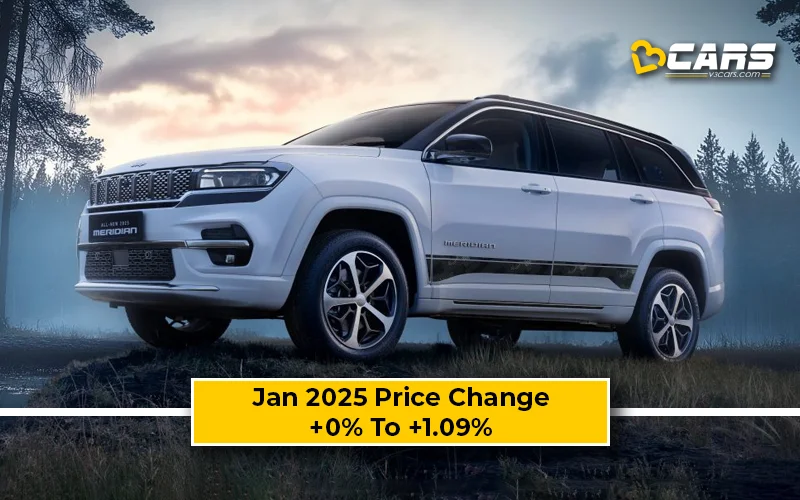
Meridian

D2

109

404

-295

-73.02%

39

Volkswagen

Tiguan

C2

98

83

15

18.07%

40

Hyundai

Kona

C1

44

106

-62

-58.49%

41

Citroen

C5 Aircross

C2

5

15

-10

-66.67%

42

Honda

WR-V

B2

-

653

-653

-100.00%

43

Mahindra

Alturas G4

D2

-

40

-40

-100.00%

44

Nissan

Kicks

C1

-

242

-242

-100.00%

SUV Segment October 2023 Car Sales - MoM Change

  • Top Gainers:
    • Tata Punch (B1): Punch tops the MoM change with an impressive 17.50% increase in sales. Tata's strategic marketing or potential customer response to specific features might be contributing to this positive trend.
    • Tata Harrier (C2): Harrier experiences a significant MoM surge, with sales increasing by 104.75%. This notable rise could be due to promotional activities, customer interest, or enhancements in the model.
    • Mahindra Scorpio N + Classic (D1): Scorpio N + Classic continues its positive momentum with a 14.62% increase in sales MoM. Mahindra's consistent performance in this segment is evident.
  • Top Losers:
    • Maruti Nexa Jimny (B2): Jimny faces a substantial MoM decline of -30.14%, suggesting a potential shift in consumer interest or market dynamics for this particular model.
    • Maruti Nexa Grand Vitara (C1): Grand Vitara experiences a MoM decrease of -7.69%, indicating possible challenges or changes in market preferences for this model.
    • Hyundai Venue (B2): Venue records a MoM decline of -5.10%, showcasing a slight dip in sales. Factors such as increased competition or market dynamics may contribute to this change.
  • Other Observations:
    • Consistent Performers: Nexon, Brezza, and Punch maintain their positive momentum, reflecting sustained demand in the subcompact and compact SUV segments.
    • Segment-Wise Variations: The MoM performance varies across segments. While compact SUVs like Punch and Venue show positive trends, midsize SUVs like Harrier and Creta also experience significant increases.
    • Electric Vehicle Challenges: EV6 and ZS EV face MoM declines, indicating potential challenges or variations in the electric vehicle market.
    • New Entrants and Surprises: Fronx maintains stability, but Jimny faces a decline. The introduction of new models or changes in consumer preferences could contribute to these outcomes.
    • Competitive Landscape: The SUV market remains competitive, with shifts in MoM performance reflecting the dynamic nature of consumer choices, market trends, and external factors.
  • In summary, while some models continue their positive trajectory, others face challenges or fluctuations in demand, highlighting the ever-changing landscape of the SUV market in October 2023.

SUV OCTOBER 2023 CAR SALES

MOM CHANGE

S.No.

Brand

Model

Segment

Oct 2023

Sep 2023

Change

%Change

Trend

1

Tata

Nexon

B2

16,887

15,325

1,562

10.19%

2

Maruti Suzuki

Brezza

B2

16,050

15,001

1,049

6.99%

3

Tata

Punch

B1

15,317

13,036

2,281

17.50%

4

Mahindra

Scorpio N + Classic

D1

13,578

11,846

1,732

14.62%

5

Hyundai

Creta

C1

13,077

12,717

360

2.83%

6

Kia

Seltos

C1

12,362

10,558

1,804

17.09%

7

Hyundai

Venue

B2

11,581

12,204

-623

-5.10%

8

Maruti Nexa

Fronx

B2

11,357

11,455

-98

-0.86%

9

Maruti Nexa

Grand Vitara

C1

10,834

11,736

-902

-7.69%

10

Mahindra

Bolero + Neo

B2

9,647

9,519

128

1.34%

11

Mahindra

XUV700

D1

9,297

8,555

742

8.67%

12

Hyundai

Exter

B2

8,097

8,647

-550

-6.36%

13

Kia

Sonet

B2

6,493

4,984

1,509

30.28%

14

Mahindra

Thar

B2

5,593

5,417

176

3.25%

15

Honda

Elevate

C1

4,957

5,685

-728

-12.81%

16

Mahindra

XUV300

B2

4,865

4,961

-96

-1.94%

17

Toyota

Hyryder

C1

3,987

3,804

183

4.81%

18

MG

Hector + Hector Plus

D1

2,703

2,653

50

1.88%

19

Nissan

Magnite

B2

2,573

2,454

119

4.85%

20

Toyota

Fortuner

D2

2,475

2,874

-399

-13.88%

21

Skoda

Kushaq

C1

2,447

2,260

187

8.27%

22

Volkswagen

Taigun

C1

2,219

1,586

633

39.91%

23

Tata

Harrier

C2

1,896

926

970

104.75%

24

Maruti Nexa

Jimny

B2

1,852

2,651

-799

-30.14%

25

Hyundai

Alcazar

C2

1,837

1,977

-140

-7.08%

26

Tata

Safari

D1

1,340

516

824

159.69%

27

Renault

Kiger

B2

912

980

-68

-6.94%

28

MG

Astor

C1

890

901

-11

-1.22%

29

Mahindra

XUV400

B2

639

825

-186

-22.55%

30

Jeep

Compass

C2

398

391

7

1.79%

31

MG

Gloster

D2

247

201

46

22.89%

32

MG

ZS EV

C1

232

228

4

1.75%

33

Citroen

C3

B2

222

179

43

24.02%

34

Hyundai

Tucson

D1

202

237

-35

-14.77%

35

Citroen

EC3

B2

179

166

13

7.83%

36

Skoda

Kodiaq

D1

176

191

-15

-7.85%

37

Kia

EV6

D1

141

150

-9

-6.00%

38

Jeep

Meridian

D2

109

90

19

21.11%

39

Volkswagen

Tiguan

C2

98

191

-93

-48.69%

40

Hyundai

Kona

C1

44

69

-25

-36.23%

41

Citroen

C5 Aircross

C2

5

3

2

66.67%

SUV Cars — 6-Month Sales Trend (May 2023 - October 2023)

SUV 6 MONTH SALES TREND

MAY 2023 - OCTOBER 2023

Brand

Model

Segment

May 2023

Jun 2023

Jul 2023

Aug 2023

Sep 2023

Oct 2023

6 Month Avg

Maruti Suzuki

Brezza

B2

13,398

10,578

16,543

14,572

15,001

16,050

14,357

Hyundai

Creta

C1

14,449

14,447

14,062

13,832

12,717

13,077

13,764

Tata

Nexon

B2

14,423

13,827

12,349

8,049

15,325

16,887

13,477

Tata

Punch

B1

11,124

10,990

12,019

14,523

13,036

15,317

12,835

Hyundai

Venue

B2

10,213

11,606

10,062

10,948

12,204

11,581

11,102

Maruti Nexa

Fronx

B2

9,863

7,991

13,220

12,164

11,455

11,357

11,008

Mahindra

Scorpio N + Classic

D1

9,318

8,648

10,522

9,898

11,846

13,578

10,635

Maruti Nexa

Grand Vitara

C1

8,877

10,486

9,079

11,818

11,736

10,834

10,472

Mahindra

Bolero + Neo

B2

8,170

8,686

8,921

9,092

9,519

9,647

9,006

Kia

Seltos

C1

4,065

3,578

9,740

10,698

10,558

12,362

8,500

Mahindra

XUV700

D1

5,245

5,391

6,176

6,512

8,555

9,297

6,863

Kia

Sonet

B2

8,251

7,722

4,245

4,120

4,984

6,493

5,969

Hyundai

Exter

B2

-

-

7,000

7,430

8,647

8,097

5,196

Mahindra

Thar

B2

4,296

3,899

5,265

5,951

5,417

5,593

5,070

Mahindra

XUV300

B2

5,125

5,094

4,533

4,992

4,961

4,865

4,928

Toyota

Hyryder

C1

3,090

2,821

3,387

4,121

3,804

3,987

3,535

Toyota

Fortuner

D2

2,887

3,086

3,129

2,825

2,874

2,475

2,879

Nissan

Magnite

B2

2,618

2,552

2,152

2,258

2,454

2,573

2,435

MG

Hector + Hector Plus

D1

2,800

2,170

2,103

2,059

2,653

2,703

2,415

Honda

Elevate

C1

-

-

-

2,822

5,685

4,957

2,244

Skoda

Kushaq

C1

1,685

2,133

2,394

2,409

2,260

2,447

2,221

Hyundai

Alcazar

C2

2,443

2,119

1,443

1,493

1,977

1,837

1,885

Tata

Harrier

C2

2,303

2,040

2,092

1,689

926

1,896

1,824

Volkswagen

Taigun

C1

1,484

1,449

1,908

1,943

1,586

2,219

1,765

Tata

Safari

D1

1,776

1,663

1,687

1,019

516

1,340

1,334

Maruti Nexa

Jimny

B2

-

-

-

3,104

2,651

1,852

1,268

Renault

Kiger

B2

1,713

1,844

1,043

929

980

912

1,237

MG

Astor

C1

592

891

954

814

901

890

840

Mahindra

XUV400

B2

696

788

707

778

825

639

739

MG

ZS EV

C1

1,397

617

587

421

228

232

580

Citroen

C3

B2

600

867

331

250

179

222

408

Jeep

Compass

C2

316

211

277

172

391

398

294

Hyundai

Tucson

D1

379

263

239

236

237

202

259

MG

Gloster

D2

217

263

251

240

201

247

237

Jeep

Meridian

D2

418

282

164

127

90

109

198

Skoda

Kodiaq

D1

157

194

159

241

191

176

186

Citroen

EC3

B2

200

124

49

271

166

179

165

Volkswagen

Tiguan

C2

171

133

169

91

191

98

142

Kia

EV6

D1

83

44

15

42

150

141

79

Hyundai

Kona

C1

84

75

60

91

69

44

71

Citroen

C5 Aircross

C2

6

12

8

4

3

5

6

Note: Calculate Car Fuel Cost with V3Cars for India and Other Countries

ABOUT THE AUTHOR

Prathu Sharma

Engineer by upbringing, artist by passion, motorhead because, why not! Likes to know about everything related to technology, switches between american muscle and german innovation depending on the day. Wants to own 69' Mustang Mach 1 and to drive BMW M3 87'someday.

0 Comments

Leave a Reply